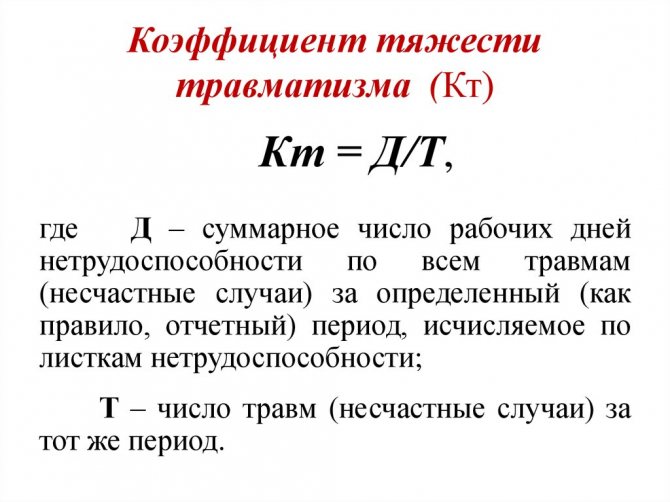
What determines the relative indicator: injury severity coefficient
Labor protection legislation has as its most important task the preservation of the health and life of citizens during the performance of their work functions. However, at many production facilities, the specific nature of the activity involves the possibility of injury, injury or other harm to life and health. To analyze such information and prevent the recurrence of such situations, a special technique has been developed to identify certain relationships in injuries and the time for which the employee subsequently leaves the work process.
Standard formula for determining the degree of injury at a typical enterprise
Such an analysis is carried out both by the organization’s regular departments every year, and on the basis of general data, an assessment is made for all enterprises in certain economic sectors and industries. For this purpose, special mathematical calculation formulas are used, called the injury rate.
Important! There is also an indicator that means the approximate amount of time, calculated in calendar days, for which an employee will be out of production if he receives a typical injury, taking into account the specifics of the activities of a particular organization.
Depending on the nature of the work performed, each company has a list of typical hazards, which may include electric shock, flame burns, chemical poisoning, the danger of falling from a height, the likelihood of mechanical damage and fractures from the impact of various equipment. All these factors are taken into account when calculating the injury rate according to OKVED, which will take into account not only the risk of injury without reference to a specific profession, but also the likelihood of negative consequences when performing work duties at a specific enterprise in a certain industry.
In addition to the positive effect in determining the degree, number of injuries and other important factors at work, which make it possible to improve internal work to ensure safe work activities, federal legislation assigns the need to collect such information and calculate such a degree to each employer. After the end of the calendar year, the responsible worker must calculate, determine and measure these statistics for the entire enterprise and, within a specified period, most often in January, send such a list to the state labor safety inspectorate. This government body maintains a centralized count of industrial accidents throughout the country and assesses the performance of individual large production associations.
Important! Such work in the organization is carried out by labor protection specialists, who, in addition to the special knowledge acquired in educational institutions, collect and analyze information from other regular departments of the corporation. In addition, such work must be controlled by the management of the enterprise.
Calculation of the probability of injury in an organization
Guide: Work Accident
Changes have been made to the Decree of the President of the Russian Federation dated May 6, 2020 N 313, including those concerning the procedure for confirming insured events, upon the occurrence of which an insurance payment is made to certain categories of health workers directly working with patients who are confirmed to have coronavirus.
See Decree of the President of the Russian Federation dated July 30, 2020 N 487. Changes will be taken into account in the material when it is updated. An industrial accident is an event as a result of which an employee died or suffered health damage while performing work duties or work in the interests of the employer (part 1 of article 227 of the Labor Code of the Russian Federation, paragraph 10 of article 3 of Federal Law of July 24, 1998 N 125 -FZ, part 3, clause 3 of the Regulations on the peculiarities of the investigation of accidents, approved by Resolution of the Ministry of Labor of Russia dated October 24, 2002 N 73, hereinafter referred to as the Regulations on the investigation of accidents).
Continue reading in ConsultantPlus
Formulas for calculation
Severity of work injury
The industrial injury rate is calculated using special formulas. To analyze the data, officials will need certain information:
- The average composition of workers at the enterprise, broken down by quarter, and under certain circumstances, by month. This indicator is necessary to determine the frequency of manifestation of negative factors among all workers and personnel of the organization;
- The number of negative events, which will include emergency situations, accidents, and industrial accidents. Such numbers are needed to calculate not only the general state of labor protection standards, but also to identify trends over a certain period - a quarter, a year, a five-year plan;
- The total number of calendar days during which all affected workers were suspended from performing their work function. A formal analysis of this criterion should help determine the company's total economic losses for the reporting period, and with its help, responsible officials should determine in which period the largest number of injuries occur.
Important! In addition, to accurately determine both the degree of frequency and a certain coefficient, information is required on the distribution of the number of victims into certain categories depending on the damage to health received.
- Minor injuries that do not lead to loss of performance for a long period and do not require qualified medical care;
- Injuries that entail partial loss of working skills for a short period of up to 3 days;
- Severe injuries due to which the employee cannot perform his job function for 3 days or more and leaves production for this period.
In this case, various formulas are used depending on the criterion for determining the hazard factor:
- The frequency of injuries and injuries is calculated using the formula Kch = (Ni/Np)*1000, in which 1000 is an indicator for large organizations with a staff of over a thousand people, the values of N are the number of workers who lost their ability to work due to moderate and severe injuries;
- The severity of industrial injuries is determined using the formula Kt = Dn / (N – Ncm) in which Dn is the number of calendar days for which the employee was out of work when injured, and (N – Ncm) is the total number of victims in accidents minus the number of deceased employees.
Important! Such calculations should be carried out only if objective, relevant and confirmed information is available. That is why calculations are carried out for a certain calendar period.
Determining the degree and severity of harm to health with formulas
Result evaluation
Obtaining calculated data for one of the coefficients for a separate reporting period does not allow for a full analysis of the effectiveness of the labor protection department. There are no standard values for the occupational injury frequency rate. The results obtained from the calculations have nothing to compare with - there are no control ratios for this group of statistical values. The value of the indicator in different areas of activity will fluctuate within its range.
BY THE WAY, when comparing injury frequency rates in different industries, it is impossible to obtain objective data - each area has an individual percentage of accident risk and its own special working conditions. Comparisons can only be made between companies from the same market segment.
Calculations can be carried out in the context of enterprises, separate divisions, workshops and departments, professions. For large-scale analysis, injury rates calculated for the entire industry, region or state are used. The results obtained are assessed in the following ways:
- Comparison of the coefficient with the indicator of competing enterprises that have similar working conditions. This makes it possible to understand how effectively work in production is organized in comparison with other business entities, to identify weaknesses and discover reserves for minimizing risks and strengthening positions in competition.
- Comparison of results over time. In this case, information on one subject is analyzed for different time intervals of the same duration - annual analysis, quarterly or monthly. Based on the information received, a diagram or graph is constructed that will clearly demonstrate the improvement or deterioration of the safety situation at production facilities.
- Comparison of coefficient values for different departments of one enterprise to identify the most dangerous areas.
Calculating the injury frequency rate is an effective tool for analyzing the results of modernizing production assets, changing technology or introducing new developments. For the assessment, the calculated injury rates for the period in which the innovations were made and adjacent intervals were used:
- if, compared to previous time periods, there is an increase in the number of accidents after production changes, then the measures taken would have a negative impact on labor safety, and the working conditions of hired personnel would worsen;
- during the period of commissioning of new equipment and in subsequent reporting periods, in comparison with previous indicators, a reduction in the injury frequency rate was revealed - updating production technology had a positive effect;
- no changes in the frequency of injuries are observed - the renewal of production assets did not affect labor safety.
Injury Severity Index
Prevention of occupational injuries
The severity of the damage indicates the presence of certain hazardous production factors. When determining it, the responsible official must also identify weaknesses in the organization of the security system, errors in the implementation of direct activities and apply an effective set of measures to prevent them.
The injury severity formula indicates the correct use of protective equipment, compliance by workers with instructions, and, if the results of the investigation are received, indicates the condition of the equipment and violations in its operation. In this case, the calculation must be carried out without fail in accordance with local regulations on maintaining safety at work.
![]()
Calculation formula for companies with a large number of employees
The concept of PT and its analysis
When analyzing PT, the number and degree of damage received by employees while performing their job duties and manager’s assignments are taken into account. PT, of course, is studied not only using the statistical method. After an accident occurs, the Labor Code obliges the manager to create a commission to investigate it.
During the inspections, working conditions at each workplace and the circumstances of the incident are examined in detail. This method of analysis is called monographic. There is also topographical, in the process of application, statistical data for a certain period is established by displaying production on a map. This is how areas of the enterprise that are dangerous for employees are determined.
The injury rate, one or another, can be taken into account when using any method, but adjusted for the purposes of the study, its main methods and periods. For example, it characterizes and demonstrates how things are with PT at an enterprise, in a workshop, at a work site for a certain period of time.
It fulfills its direct purpose only in a statistical method, in which the concept of “occupational injury frequency rate” is widely used - which determines the number of accidents per 1000 workers. That is, it demonstrates the level of PT, but still with an insufficiently high degree of reliability, so it must be taken into account along with other objective data.
Occupational injury frequency rate
Methods for analyzing industrial injuries
Analysis of information from this area allows us to determine the period of time during which an accident occurs in a certain staff unit and the company as a whole. This method of analysis also allows us to develop an effective set of measures to neutralize constant or emerging threats that can cause injury to a citizen and manifest themselves over a certain period. Also, responsible officials can find out the most dangerous period of work, during which the occurrence of such cases becomes more frequent.
Methods for analyzing production factors harmful to personnel health
We analyze industrial injuries and occupational diseases
The study of industrial injuries and occupational morbidity is aimed at identifying dangerous moments in work, as well as at establishing the most rational methods and methods of work, and the correct organization of work. The purpose of this event is to prevent accidents and occupational diseases. In the article we will talk about methods for studying industrial injuries and occupational morbidity.
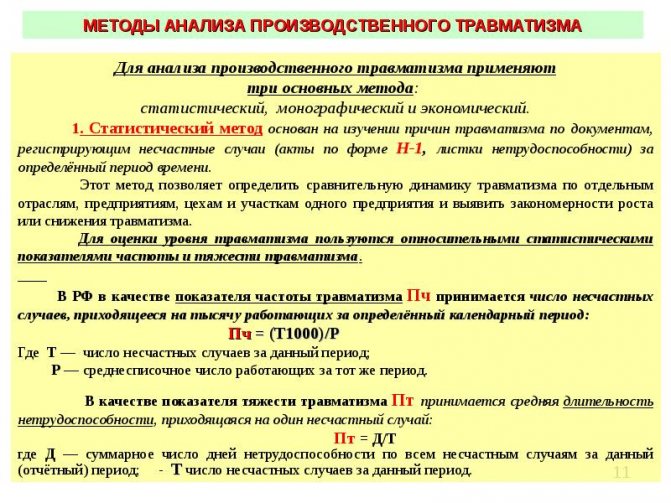
When analyzing work to ensure healthy and safe working conditions at an enterprise at the end of the year, various methods are used to study industrial injuries and occupational morbidity.
The statistical method is based on studying the causes of injuries using documents in which accidents are recorded (N-1 forms, certificates of incapacity for work) for a certain period of time. This method allows you to obtain a general picture of the state of injury, determine its dynamics, identify connections and patterns between the circumstances and causes of accidents. To assess the level of injury, relative statistical indicators of the frequency and severity of injury are used.
Calculation of indicators of industrial injuries and occupational diseases
Assessment of the social effect of measures to improve labor protection is determined by comparing data on industrial injuries and occupational diseases, which are characterized by:
– coefficients of frequency of industrial injuries – Kch, Ksm;
– coefficient of severity of industrial injuries – Kt;
– frequency rate of occupational diseases – Kchpz.
The frequency rate of industrial accidents (Fr) represents the number of workers injured in industrial accidents per 1,000 workers for a certain period, and is equal to:
where N is the number of victims in industrial accidents that occurred during the period under review, people;
P – average number of employees for the period under review, people.
The fatal accident frequency rate (Kfm) represents the number of workers killed in industrial accidents per 1,000 workers during the period under review, and is equal to:
where Ncm is the number of deaths in industrial accidents that occurred during the period under review, people;
P – average number of employees for the period under review, people.
The accident frequency rate makes it possible to determine in which industry or organization accidents occur more often.
The severity coefficient of industrial accidents (Kt) represents the number of days of incapacity per victim for a certain period and is determined as follows:
where SD is the total number of days of incapacity for work due to injuries for the period under review, days;
N – number of victims in industrial accidents that occurred during the period under review, people.
This conditional indicator does not characterize the actual severity of injuries, since it, in particular, does not take into account fatal accidents at work.
The frequency rate of occupational diseases (OCF) is the number of workers diagnosed with occupational diseases per 1,000 workers for a certain period, and is equal to:
where Nпз – the number of workers who have been diagnosed with occupational diseases during the period under review, people;
P – average number of employees for the period under review, people.
In addition to a general assessment of the level of injuries, the statistical method also provides for the distribution of accidents by location, by type of work, by the nature and type of injuries and analysis of data on victims (by profession, length of service, age) and data on the time and location of the incident.
The topographic method involves analyzing accidents at the location of their occurrence. At the same time, all accidents are marked with symbols on the workshop plans, as a result of which workplaces and areas with increased risk of injury that require special attention, thorough examination and preventive measures are clearly visible.
The monographic method of studying injuries includes a detailed study of the entire complex of working conditions in which the accident occurred: the labor and technological process, the workplace, main and auxiliary equipment, collective and individual protective equipment, etc. As a result of such a study, not only the causes of accidents that have occurred are identified, but also, most importantly, the causes that can lead to injuries.
The economic method consists of determining losses caused by industrial injuries, as well as assessing the socio-economic effectiveness of measures to prevent accidents.
Morbidity analysis
In addition to analyzing occupational injuries at the enterprise, the incidence of illness among workers should be systematically analyzed.
The incidence of disease is affected by unfavorable sanitary and hygienic conditions caused by the poor organization of the enterprise, violation of the work schedule of drivers and repair workers, and insufficient mechanization of labor-intensive processes.
Working at low or high temperatures, dampness, drafts, the presence of dirt, dust, exhaust gases in production areas, lack of supply and exhaust ventilation, and poor diet lead to various diseases. To reveal the causes of diseases and take measures to prevent them, it is necessary to analyze the data that is compiled on the basis of certificates of incapacity for work.
The main method of morbidity analysis is a year-by-year comparison of morbidity rates over the same period of time (month, quarter, half-year, year). For comparison, comparison and analysis, relative values (indicators, coefficients) are used.
When analyzing morbidity with temporary disability, it is advisable to use the following indicators: intensive, extensive, visual and average duration.
The intensive index Ip shows the number of cases or days of disability per 100 workers. It is defined as follows:
where D is the number of cases (days of illness);
Рср – average number of workers.
By calculating intensive indicators for all types of diseases, it is possible to characterize the frequency of spread of individual diseases among workers.
The extensive Ep indicator gives an idea of the morbidity structure. It is expressed as a percentage and determined by the formula:
where Day is the number of cases (days) of disability for one of the diseases;
Sob – the total number of cases (days) of disability.
The indicator of visibility or ratio allows you to determine the ratio of morbidity at various production sites to the morbidity at any one production site, conditionally the morbidity at which is taken as 100%.
The visibility indicator is most often used when comparing morbidity rates across production sites.
The average duration Psr of one case of the disease is determined as follows:
where Дв – number of days of temporary disability;
St – number of cases (days) of temporary disability.
Calculating the average duration of a certificate of incapacity for work for any disease makes it possible to determine the duration of incapacity for work.
Morbidity indicators both in cases and in days of incapacity, reflected in a certain chronological order, are called a dynamic series and indicate changes in morbidity over time. A time series is constructed by comparing intensive indicators for a quarter, year, etc.
In order to find out by what percentage the incidence rates have changed compared to the previous period, their growth rate is calculated.
This indicator makes it possible to determine the greatest decrease or increase in incidence over a given period of time (month, quarter, year).
By compiling various indicators, one can judge the state of morbidity in a particular area, as well as throughout the enterprise as a whole, and outline appropriate measures for morbidity prevention.
Ella Goryunova , leading labor protection engineer at OJSC "Managing
An example of calculating the injury severity coefficient
Calculation of the severity of injuries received is carried out according to the above-mentioned formula Kt = Dn / (N – Ncm) and serves to determine the total economic damage that the enterprise will suffer as a result of the loss of employees from accidents and emergency situations. The number of days is determined based on the results of the quarter-year calendar period, the composition of employees who left is calculated based on the documents provided on the number of days spent on sick leave, and the deaths of employees are determined based on the materials of investigative actions and the information provided in the form of certificates recording the fact of death.
If we take a typical organization for a calendar year for the calculation, the resulting formula looks like: 3.8 = 196/(56-5) this means that the injury severity coefficient determines the number of total days of disability, divided by the number of cases with both fatalities and with simple injuries. A definable indicator should also show the general state of compliance with labor safety standards compared to other enterprises in a certain segment.
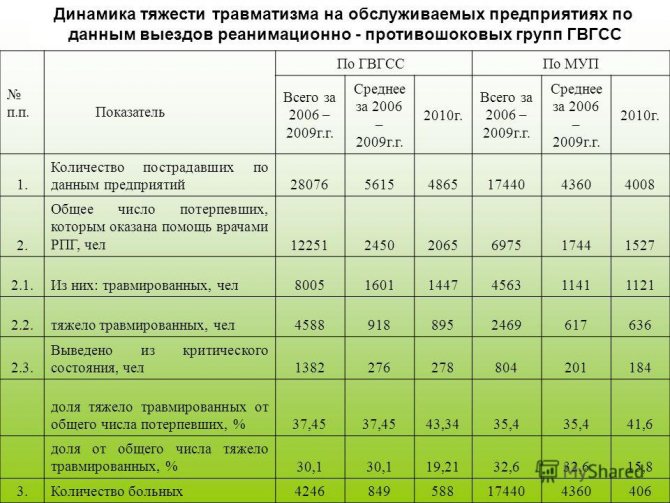
Standardized table of injury rates in a typical plant
As a result, the derivation of the occupational injury frequency rate acts as a method of mathematical analysis of data that is collected annually both for one company or staff unit, and for all industries. Its definition helps to identify the most dangerous areas of work and also to develop an effective set of measures to reduce the overall level of health harm among workers.
What characterizes the coefficient
The injury frequency rate at production facilities, calculated from reported data, displays the number of accidents at a facility over a certain period of time, linked to every thousand of the average personnel. It is recommended to calculate it systematically and analyze it over time over the past 5 years. This indicator is used to reflect a holistic picture of the state of labor protection in the company, the effectiveness of the work of a safety and health specialist.
NOTE! The level of reliability of this type of coefficient is not absolute. Errors can be leveled out by introducing additional calculated coefficients into the analysis methodology.
The disadvantage of the relative magnitude of industrial injuries is that it does not make it possible to assess the level of impact of the incident on the results of production activities.
Relative statistical indicators for assessing the level of injury.
To assess and analyze industrial injuries and occupational diseases in order to identify and eliminate their causes, several methods are used, the main of which are: statistical, topographical, monographic, group, economic, etc.
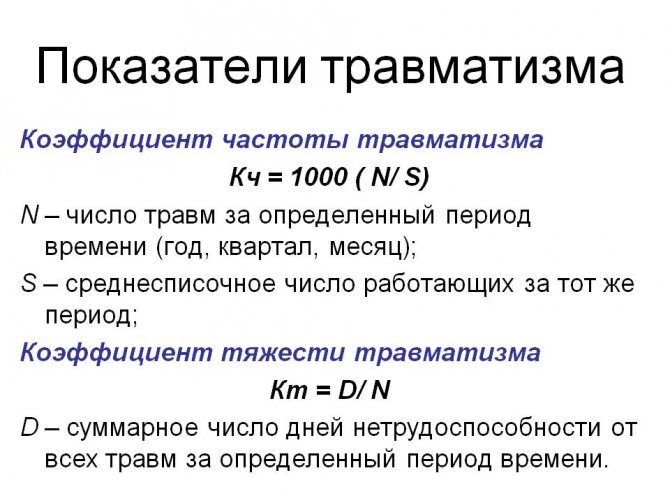
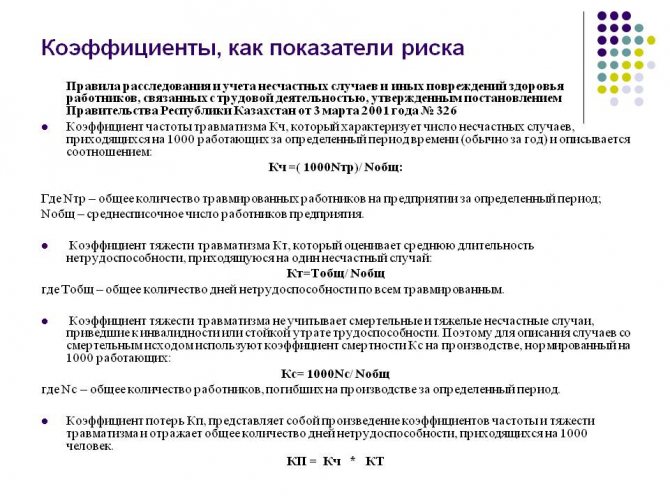
The statistical method is based on the study of injuries according to N-1 acts over a certain period of time. This method, which has become most widespread, allows for comparative dynamics of injuries in individual enterprises, workshops, and areas. To assess the level of injuries using this method, relative statistical indicators are used: the coefficient of frequency and severity of injuries, as well as the coefficient of production losses.
- frequency coefficient, which determines the number of accidents that occur per 1000 workers;
Kch = 1000 N/R;
- CT is the severity coefficient, which characterizes the average duration of disability per accident.
Kt = D/N;
- Kp.v is the production loss coefficient, which is the product of the frequency and severity coefficients.
Kp.v = 1000 D / R
Where:
N – number of accidents (injuries);
P – average number of employees;
D – the total number of days of incapacity for all accidents.
A statistical research technique makes it possible to find out the dynamics of injuries and discover certain connections and dependencies.
The topographic method is carried out at the scene of the incident.